Home › Platform › Openbots Server › Dashboards
Dashboards
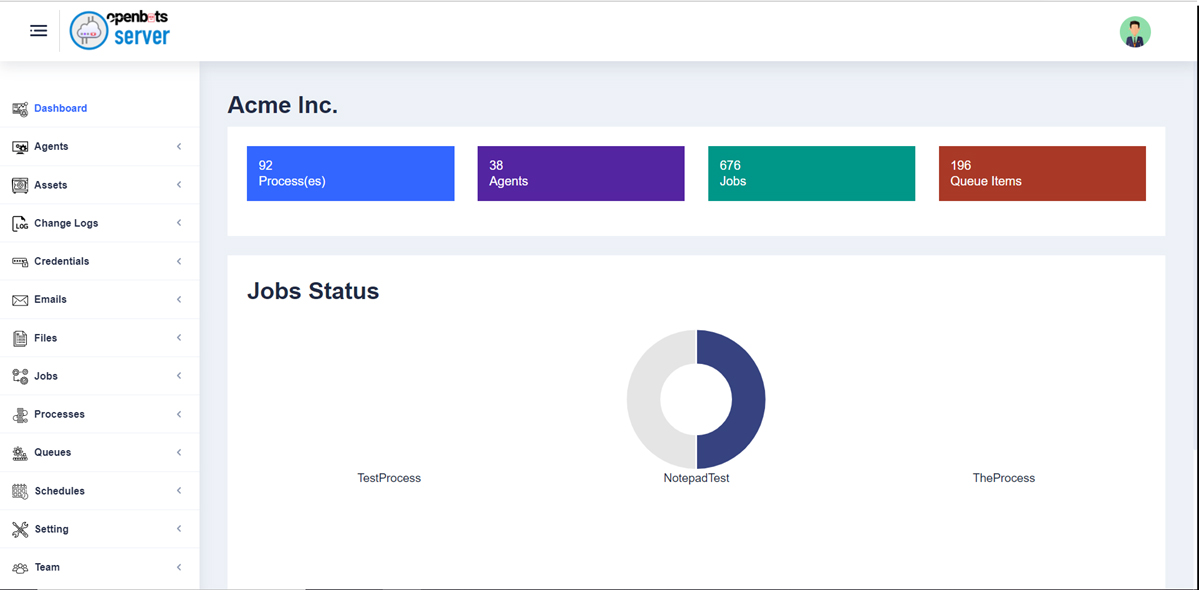
The Dashboard tab is the first page that a user will land on when they first log in to an OpenBots Server. This page acts as a way to quickly gain information on various aspects of your project including the number of processes currently attached to the Server, the number of Agents currently attached, the total number of jobs that have been run, and finally the total number of queue items. With information like this, it is incredibly simple for new team members to catch up on the status of multiple processes. The dashboard even displays the name of the organization that the instance of OpenBots Server is connected to.
In the Jobs Status section, graphs relating to the various jobs that have been run can be seen. By hovering over the different sections of the graphs, users can view the total number of times that a job has been executed, as well as the status of said jobs (Completed, InProgress, Failed, and New). With a quick glance, the statistics in regard to a particular job can be easily determined and used to save the user’s time.
The Dashboard tab is a very simple page with incredibly useful information. With it, keeping track of the different jobs could not be simpler.